
TB 为什么要报错 Timeout to process [1000] messages
正文与配图来自原稿。高并发或规则链过长时常见包超时日志,可按「定位慢节点 → 调队列/线程 → 分流」处理。
1、背景
数据量大时,常见日志:
text
Timeout to process [998] messages
... Timeout to process message: TbMsg(... type=POST_TELEMETRY_REQUEST ...), Last Rule Node: [RuleChain: Root Rule Chain|RuleNode: Message Type Switch(...)]
打印来自 DefaultTbRuleEngineConsumerService,可在源码中搜索该类定位:
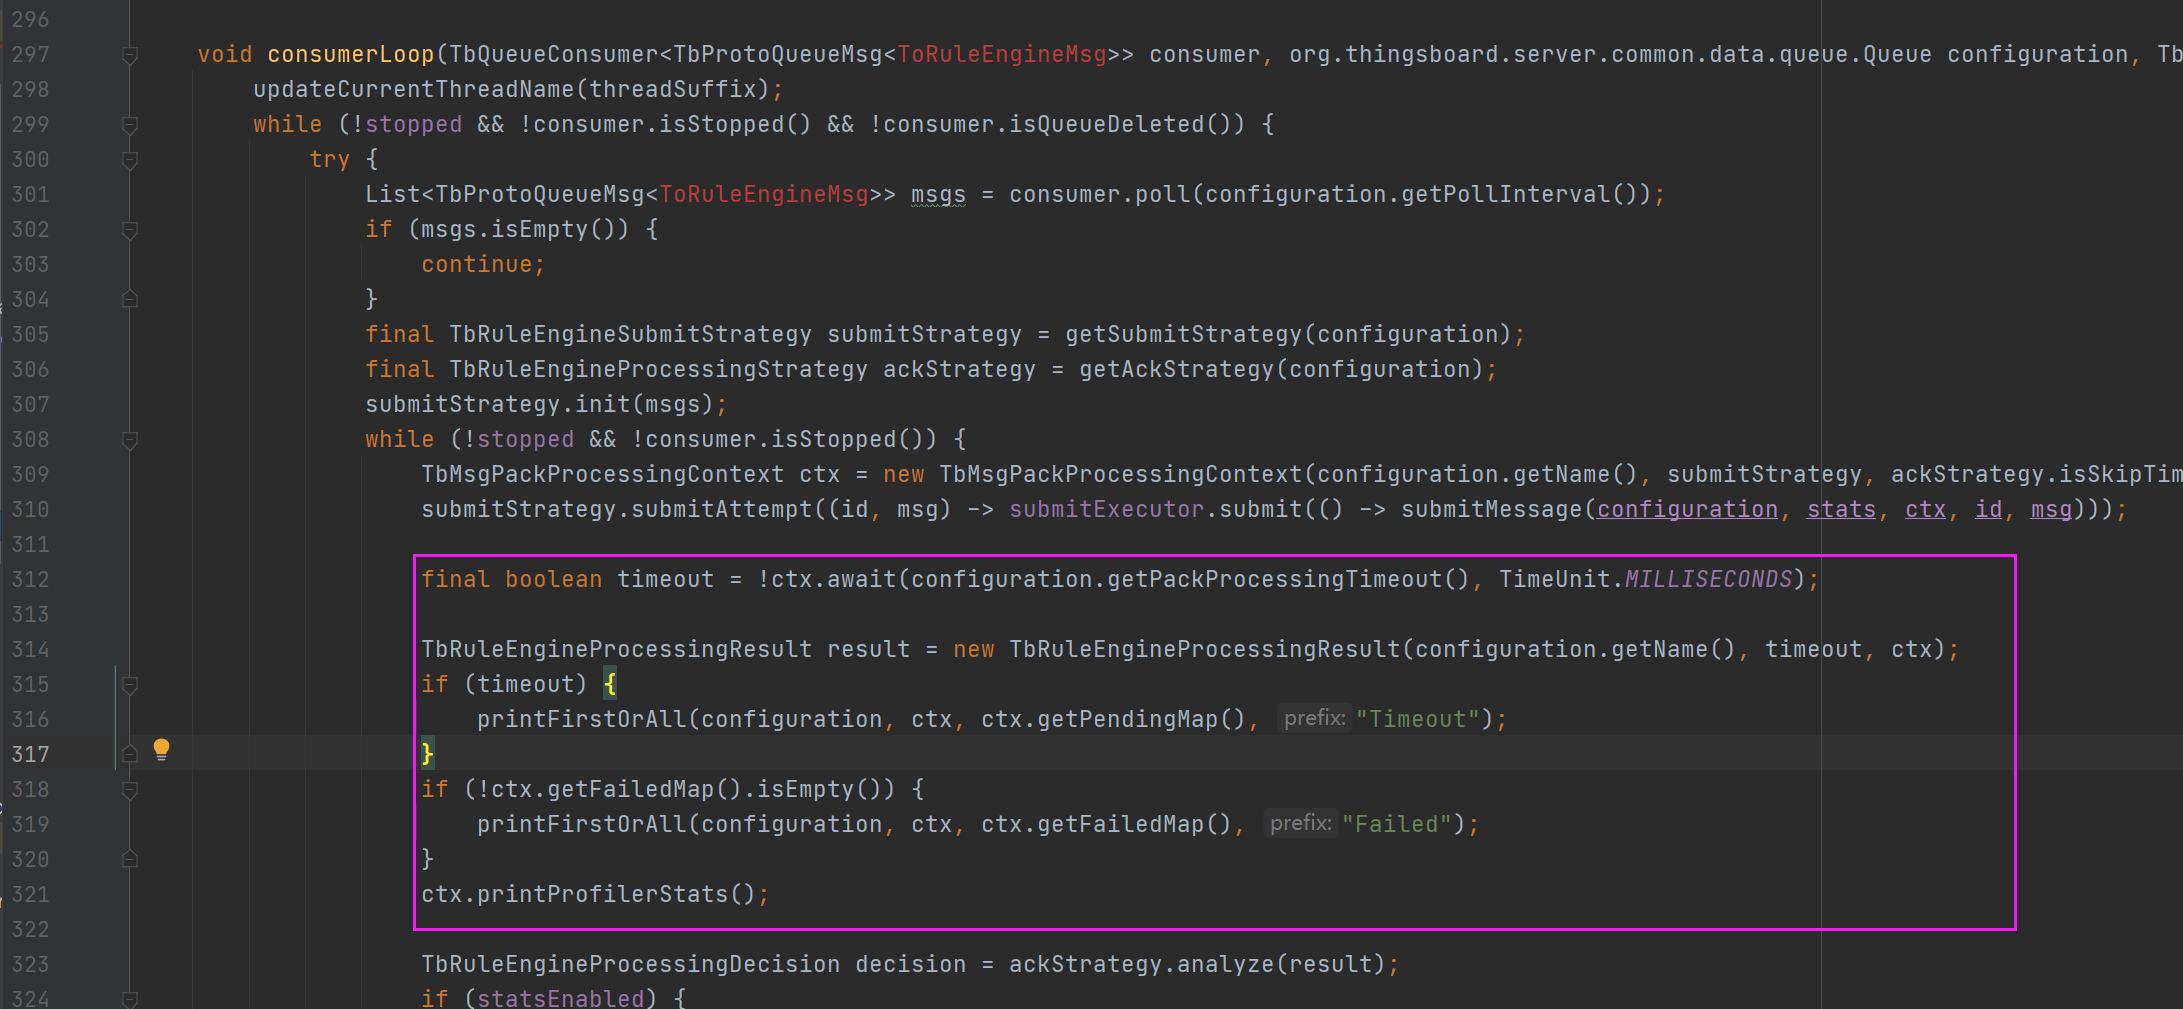
超时打印相关代码示意:
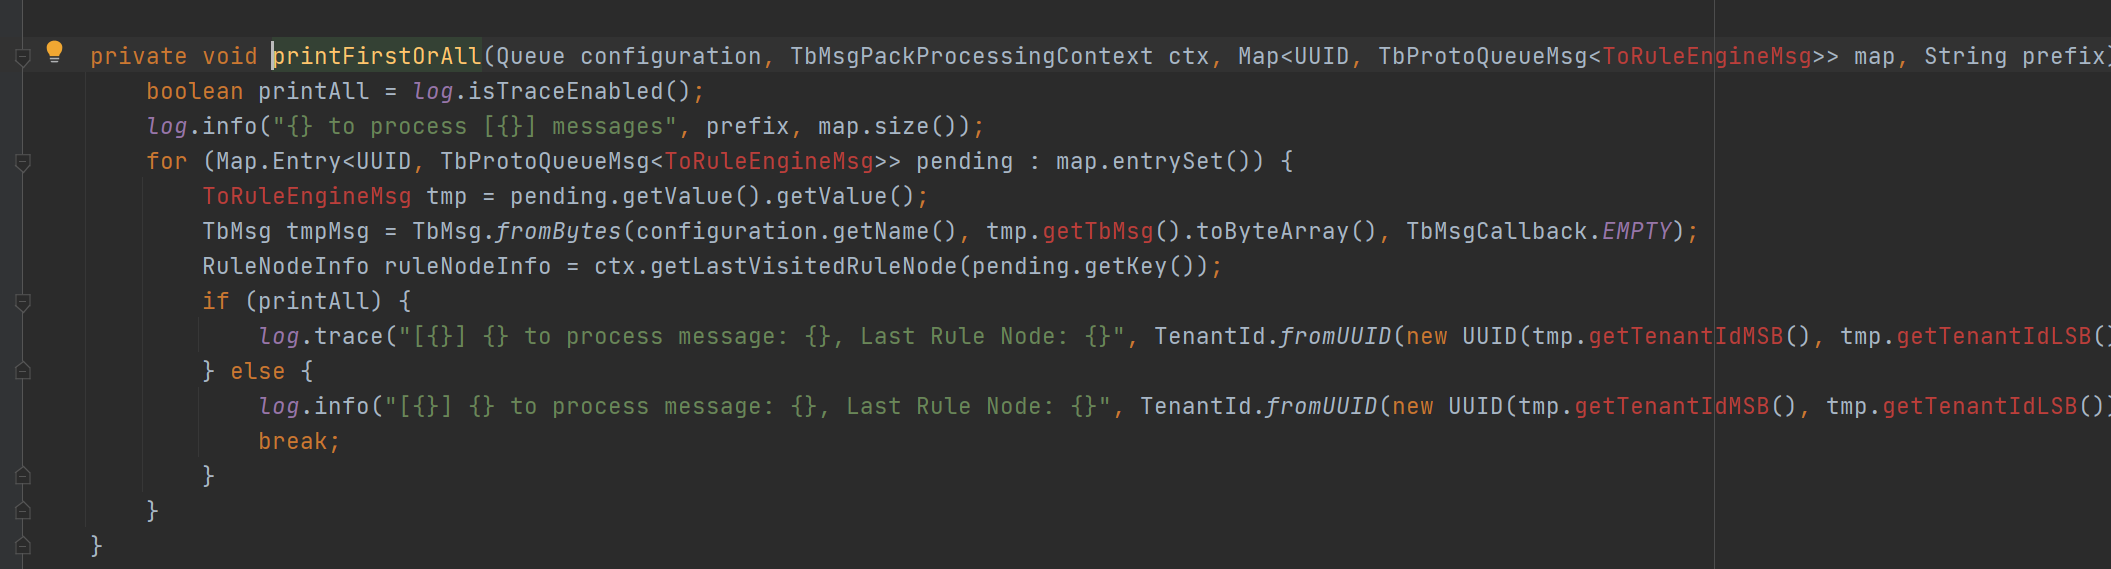
2、如何排除哪些规则链执行慢
在 logback.xml 增加:
xml
<logger name="org.thingsboard.server.service.queue.TbMsgPackProcessingContext" level="DEBUG" />Docker 示例:先拷出再改完拷回:
bash
# 从容器拷贝出来
docker cp tb360_mytbpe_1:/usr/share/thingsboard/conf/logback.xml ./logback.xml
# 拷贝进容器
docker cp ./logback.xml tb360_mytbpe_1:/usr/share/thingsboard/conf/logback.xml
3、查看日志打印信息
重启容器后可见类似:
text
DEBUG ... Top Rule Nodes by max execution time:
DEBUG ... max execution time: 81. [RuleChain: Root Rule Chain|RuleNode: Device Profile Node(...)]
...
INFO  ... Top Rule Nodes by avg execution time:
INFO  ... avg execution time: 14.33... Device Profile Node
INFO  ... Top Rule Nodes by execution count:
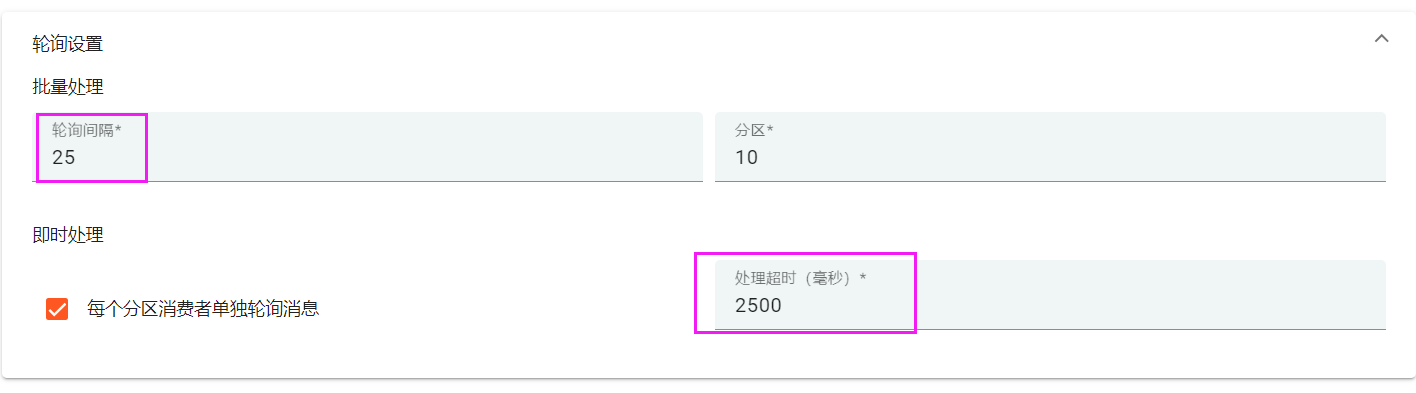
max execution time: 81 可看出各节点耗时。规则链越长,整包越容易超时——可增大 poll 间隔、增大 Main 队列超时;系统层也可配置 Main 队列处理策略:
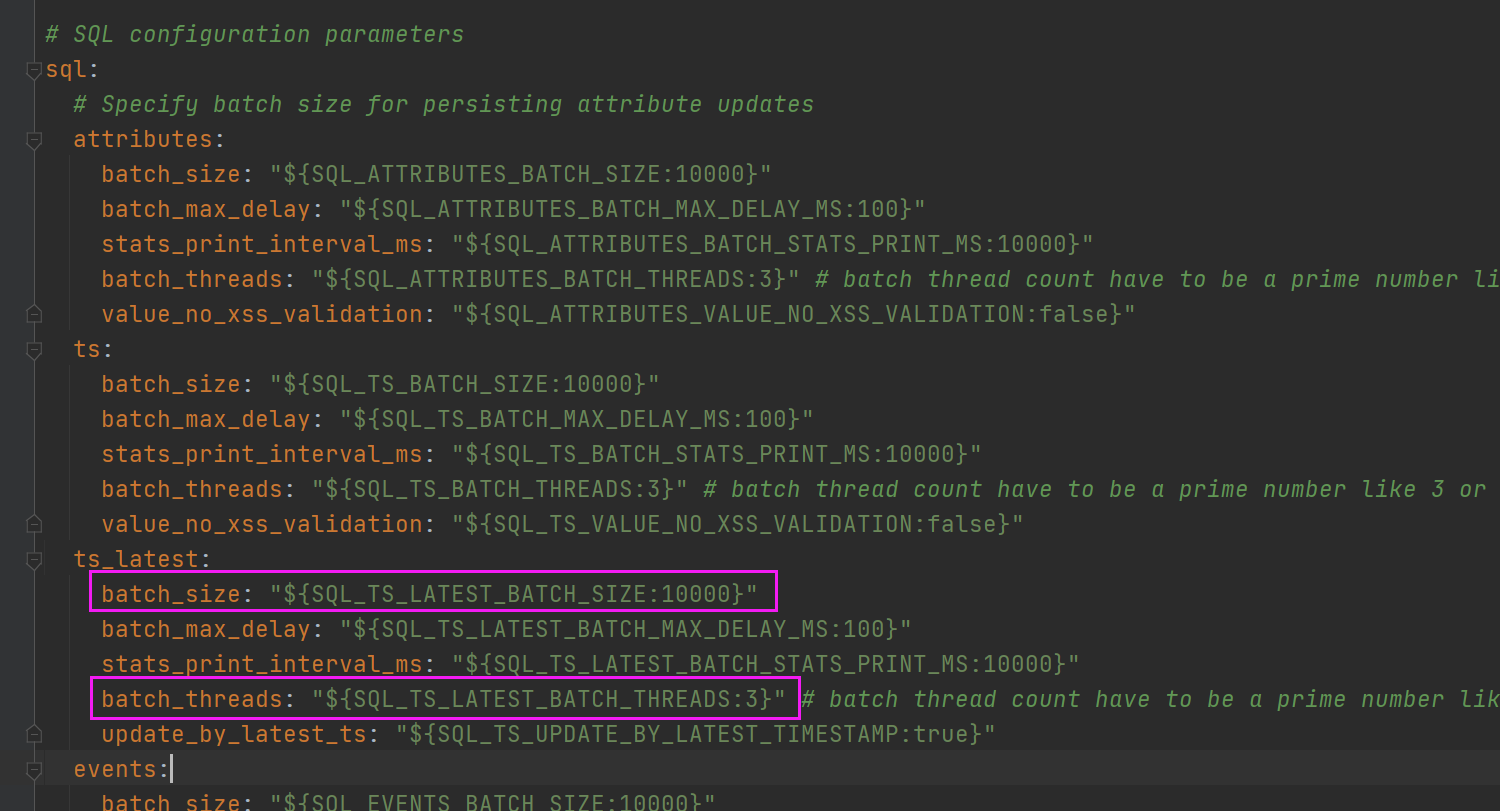
也可优化最新遥测相关线程数与线程池:
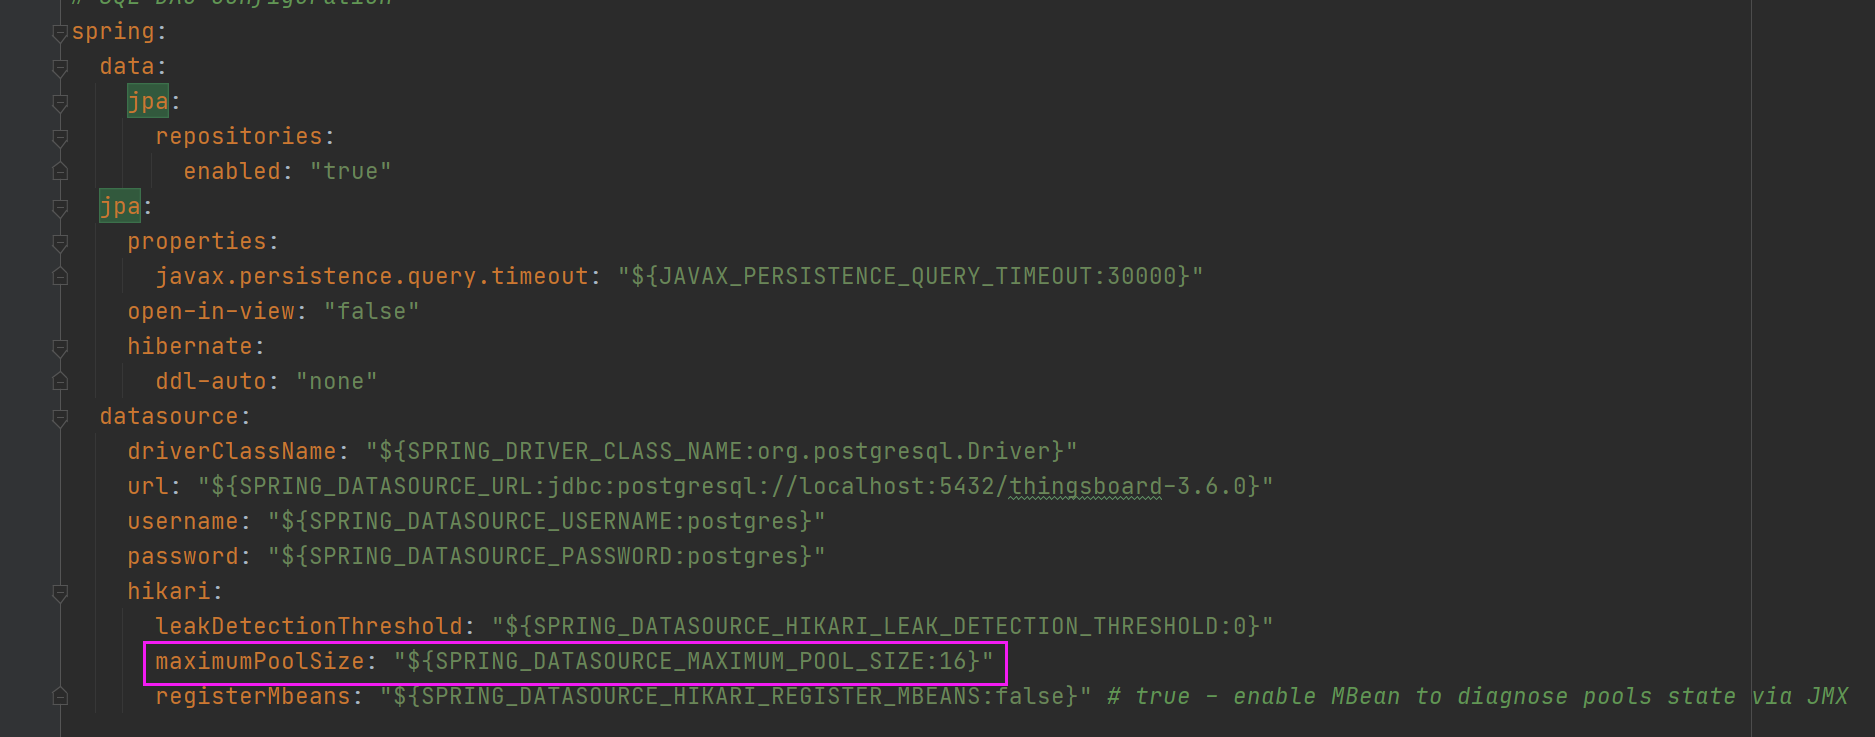
4、不同设备使用不同队列和规则链
租户创建设备配置时,可为设备指定 规则链 与 队列,避免全部打到 Main,减轻压力:
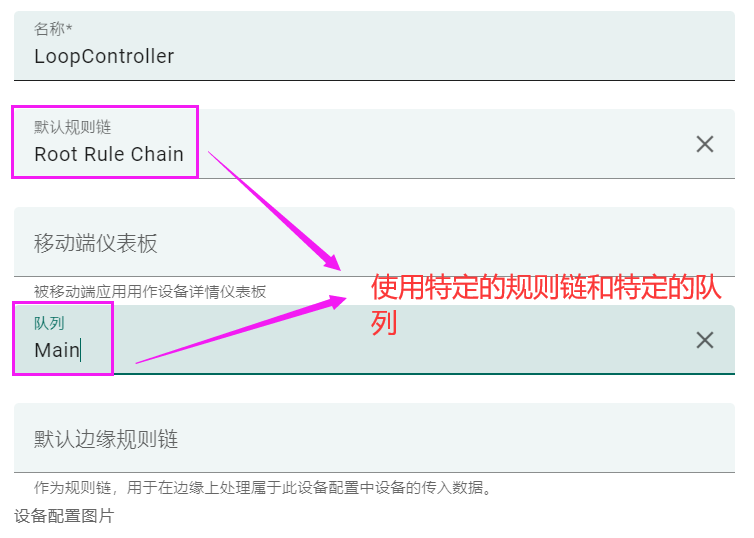
5、小结
- 打开
TbMsgPackProcessingContextDEBUG,找 max/avg 耗时节点。 - 优化慢节点,或加长队列提交超时 / 调线程。
- 高流量设备拆队列、拆规则链,不要都挤 Main。